BRANSCAN APPLICATIONS
CASE STUDY ONE: SIFTER COVER BURST
Our first case study using the Branscan applications is the Sifter Cover Burst. The following graph illustrates data sent to Branscan from a customer who has recently started to use an INLINE F4000 instrument for quality and process control of their flour mill. The data that is shown was taken from the archive, however the problem was recognized at the time, in the trend display of the software. As a result the customer was able to react promptly to rectify the problem. During production, the miller was able to establish a rapid increase in bran specks and bran percentage.

The mill was stopped and checks were made with the sifter. A small hole was found in one of the covers, which was consequently replaced, and the mill restarted.

It is evident from the Archive graph, to see the spike in specks and percentage, and how fast the mill returned to its expected production, once the sifter cover was replaced.

When analysing the Archive results the increase in specks is extremely significant compared to the normal production.
Needless to say our customer highly valued the response speed at detecting the route cause of the problem.
Without this system, production would have possibly ran for several hours before the problem was diagnosed. Consequently, the flour would have had to be re-processed resulting to a downturn in company profits.
The feedback given from this customer:
“the system almost paid for itself in one day.”
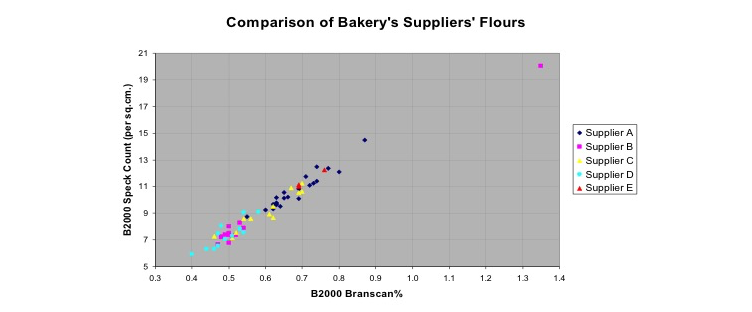
CASE STUDY TWO: BAKER BENEFITS
Our second Branscan Applications case study is the Baker Benefits. The following graph shows the variation in quality that the baker was receiving from each of his suppliers. To underline – when there are differences with the quality of flour, this in turn results in an inconsistent recipe and product, leading once again to a decrease in profits and wasting time.
The following graph shows what the millers experienced when monitoring their flour production using one of our Branscan products.

Our Branscan products supply both physical and visual quality information in real time of the product being produced. As this data shown was in real time, the operators were able to make changes to the milling process to ensure quality was consistent.
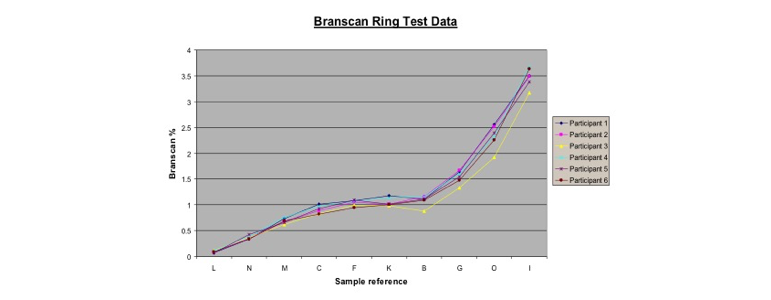
The following graph shows how consistent test samples were when scanned on different instruments located at 6 disparate sites located around the UK.
A baker recently said:
“In the last 10 years, two great things have happened:
1) De-branning
2) The ability to accurately measure bran and aleurone in flour.”
“With our suppliers using Branscan, the quality has improved from the suppliers and, more importantly, the consistency of flour has improved as well.”
“Using Branscan results as quality control means we no longer have to worry about the flour we buy from our suppliers.”